IDIs & focus groups
Understand topic reports
Topic reports organize the detailed analysis of an IDI or focus-group project. Use the Topics overview to move from section summaries to individual topics, newly suggested themes, comparisons, and Custom Reports.
The following steps apply exclusively to IDIs & focus groups.
Find reports in the Topics overview
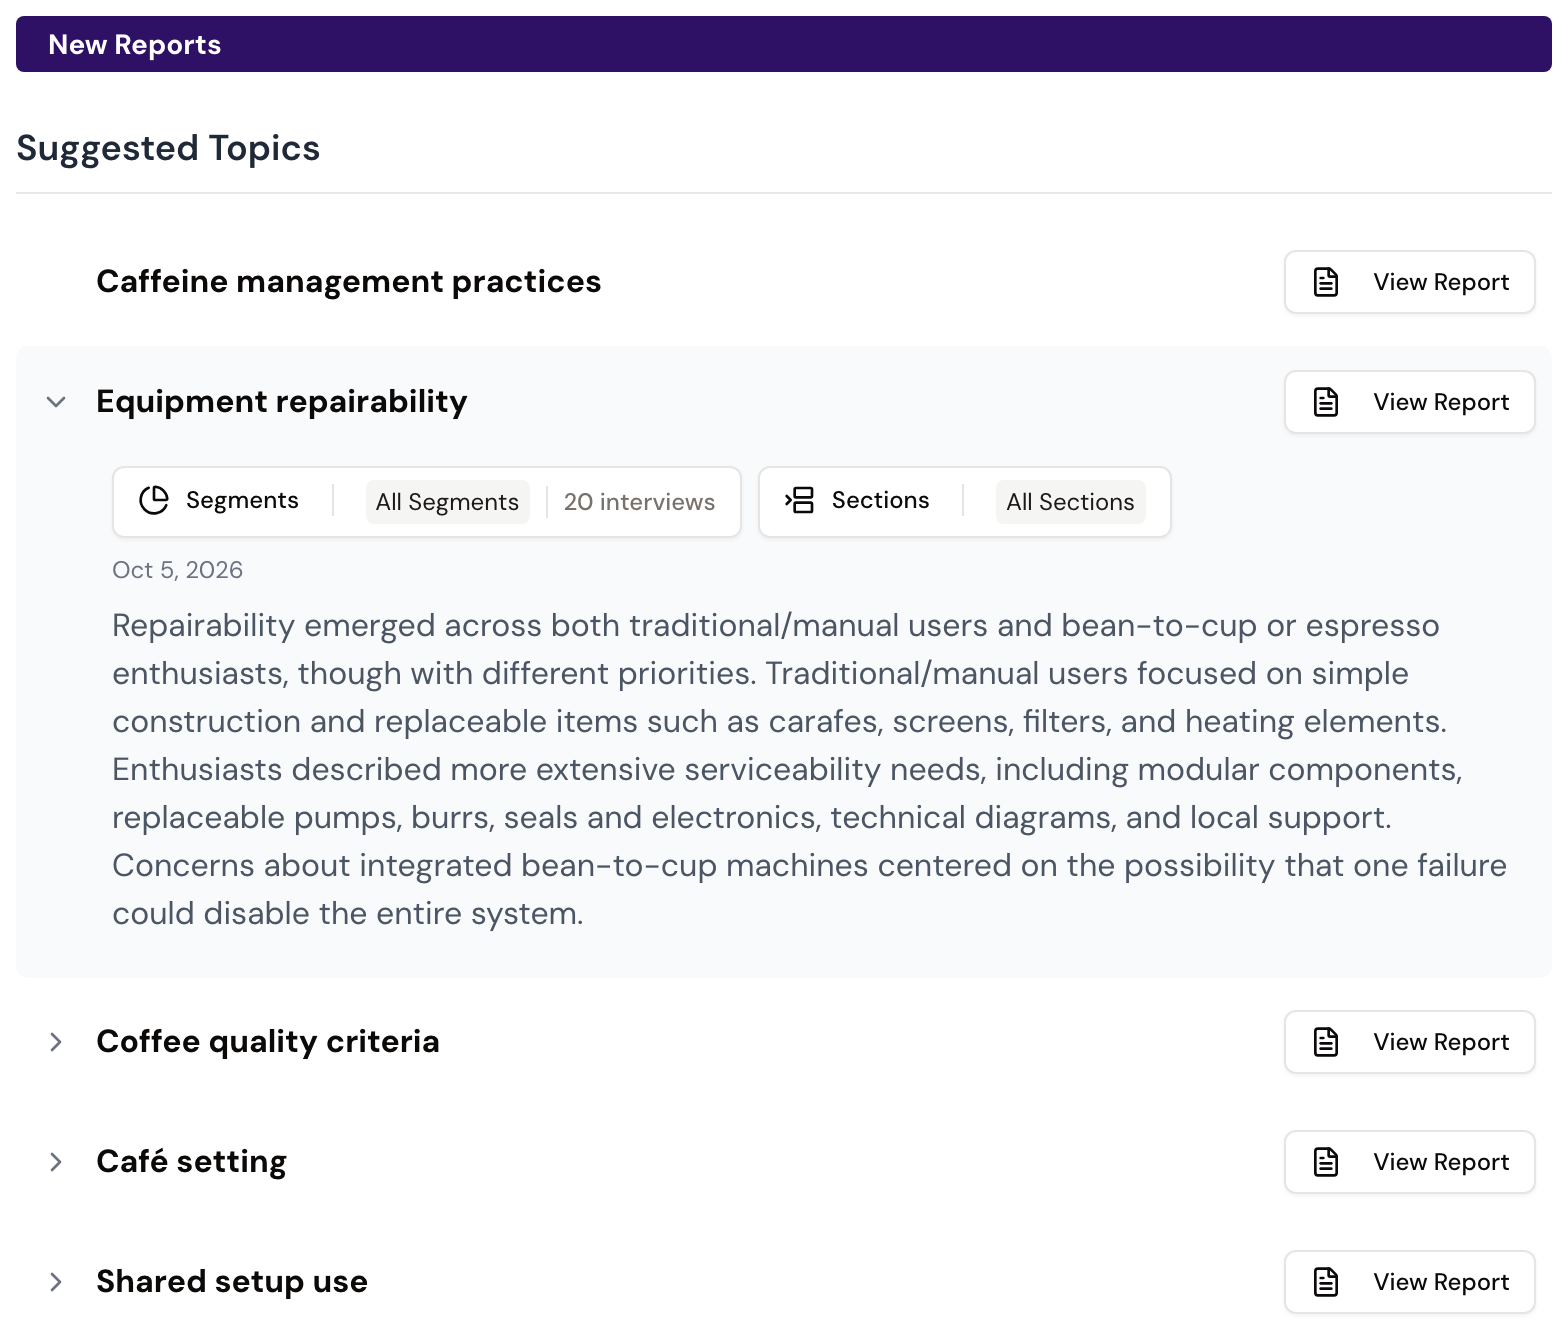
Open Overview to see the Topics page with all available reports. Use Search topics to search topic names and report text. Expand a topic to read its opening summary, or select View Report to open the complete report.
The overview separates the reports into two areas:
- Discussion Guide Reports follow the sections and topics of the discussion guide.
- New Reports contains analysis that was added outside the original guide, including Suggested Topics, xelper Comparison reports, and Custom Reports.
Understand the report groups
Discussion Guide Reports
These reports follow the structure that was used to section the transcripts:
- A report for each discussion-guide topic brings together the relevant statements from across the project.
- Summary appears at the beginning of each section and combines the topic reports in that section into one higher-level view.
A section summary links back to the topic reports it draws on. Use it to understand the section as a whole, then open the linked topic reports for more detail.
Suggested Topics
Suggested Topics contain relevant findings that emerged from the material but were not represented by a topic in the discussion guide. They use the same qualitative report structure as discussion-guide topic reports.
xelper Comparison
An xelper Comparison report compares the groups of the segment selected during the initial report generation, such as age groups. It appears as a separate group under New Reports, making it easy to distinguish from the regular topic reports.
Custom Reports
Custom Reports answer questions added after the initial analysis. They may be qualitative reports or Quantify reports. They can use segment and section filters and appear under New Reports when ready.
Learn how to create them in Custom and filtered reports.
Read a qualitative topic report
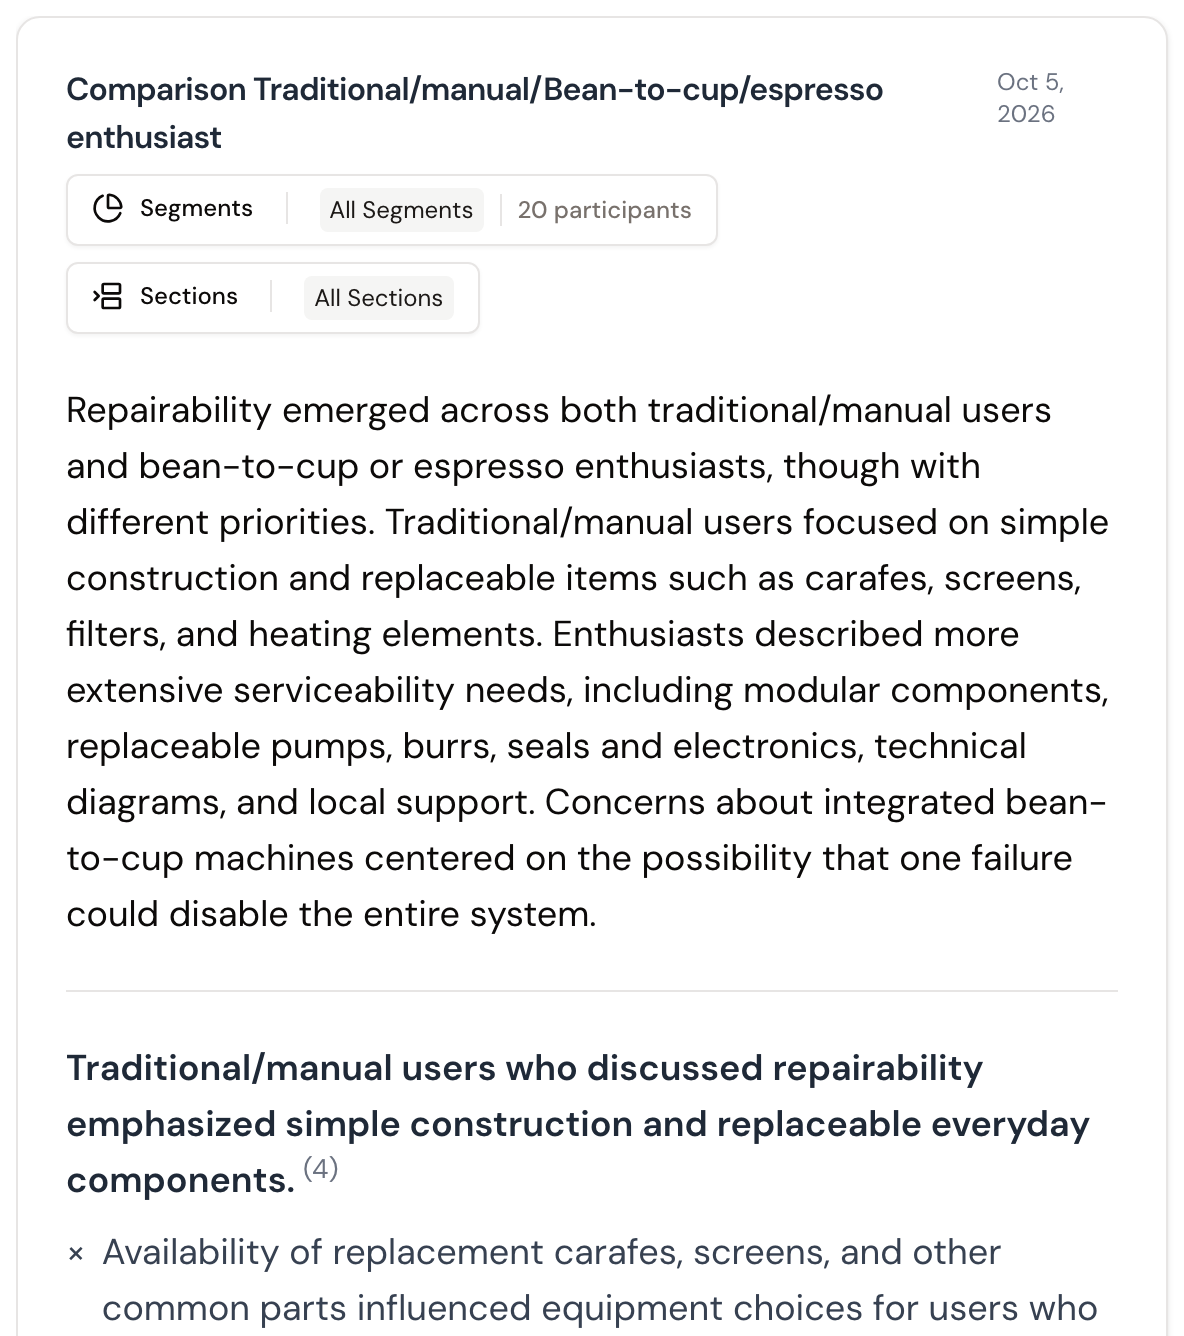
A qualitative topic report contains:
- The topic name and, for discussion-guide topics, the corresponding question.
- One or more report cards. The original report and later filtered versions can appear beside each other.
- A short overall summary followed by analytical headings and bullet points.
- Counts in parentheses that show how many distinct participants are represented in each heading or statement.
- Show notes, which opens the notes and quotes used in that report.
- Download as .docx, which exports the report.
Discussion-guide topics also provide a Transcripts tab. It shows the relevant transcript sections and lets you move from the report back to the conversation. Generated topics such as Suggested Topics, comparisons, and Custom Reports do not use this tab.
Interpret the counts
The numbers in parentheses are counts of distinct participants, not counts of words, mentions, or notes.
- A number beside a bullet point shows how many participants are represented in the evidence for that statement.
- A number beside a report heading covers the statements grouped under that heading.
- The sentence at the bottom of the report states how many source statements the report references and how many distinct participants those statements come from.
These counts describe the breadth of the evidence used in the report. They are not percentages and should not be read as survey results. One participant can support several statements, and the same participant may therefore be represented in several parts of a report.
Select a bullet point or Show notes to see the underlying notes and quotes.
Read a Quantify report
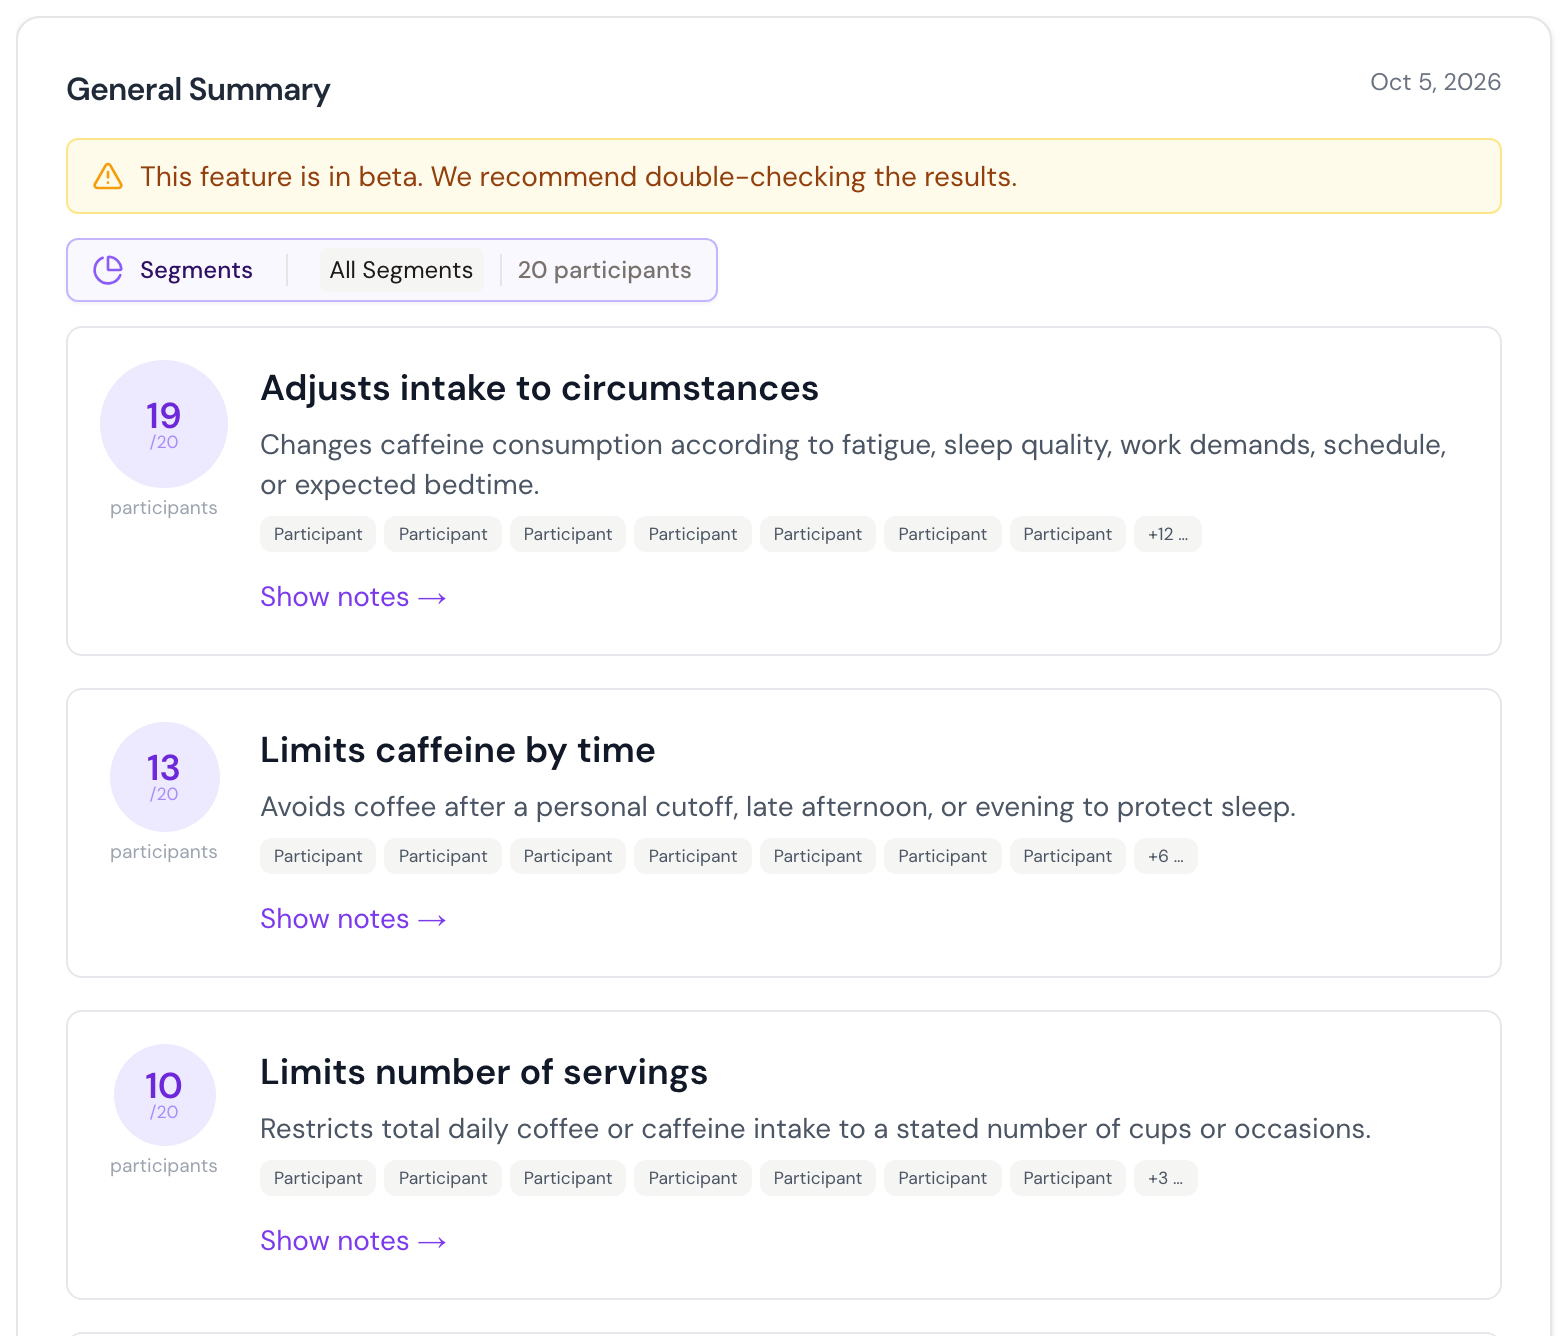
A Quantify report groups participants into categories for a defined question. Each category shows:
- the category name and description;
- the number of distinct participants assigned to it;
- the total number of participants included in the report, displayed as the denominator;
- the participant names represented in the category;
- access to the supporting notes and quotes.
Categories may overlap when one participant matches more than one category. The category counts can therefore add up to more than the report total.
When you apply the interactive Segments filter to a Quantify report, both the category counts and the displayed total update to the selected participant scope. Filters used when the report was created remain visible as the report scope.
A Quantify report cannot be used as the starting point for Create filtered report. Use its interactive segment filter to narrow the displayed counts, or create a new Quantify report when you need a different persisted segment or section scope.
Compare report versions
Creating a filtered report does not replace the existing report. The new version appears as another report card on the same topic page. Its heading, date, and filter labels identify its scope.
When several versions are present, collapse a report card to create more space and move between the versions horizontally. Open the filter labels before comparing two reports so that their participant and section scopes are clear.
Next step
Continue with Custom and filtered reports to create a new question or a focused version of an existing topic report.